
Field: Strukturomvandling
Skill relatedness matrices for Sweden
With this report Growth Analysis presents skill relatedness matrices for Sweden, based on the method in Neffke, Otto and Weyh (2017a). The matrices contain an index which reflects how workers flow (i.e., change jobs) between different industries. The relatedness index has been calculated based on registry data which encompasses the full population of employed individuals in Sweden, and the matrices can be downloaded in the column on the right.
A high index value means that there is a relatively high level of worker mobility between two industries, which indicates that there is an overlap in the human capital, the knowledge and skills, employed by the industries.
The data is made available for the benefit of interested parties such as policymakers, researchers, businesses, students, and industry organizations. They shed light on the structure of the economy and are useful for understanding a variety of aspects, such as the labor market and regional development. Here are a few examples of questions that may be addressed with the help of skill relatedness data:
- Identify groups of industries, e.g. within a region, that employ similar workers.
- If workers in a particular industry are laid off, in what other industries do they have the best prospects for finding new jobs (Eriksson and Henning, 2020)?
- What industries should a region focus on developing, given its existing knowledge base? This type of question frequently recurs in the context of the EU’s smart specialization policy framework.
- What region has the most suitable human capital foundation for developing a particular industry?
- If a firm is looking to recruit new personnel, in what other industries is it most likely to find qualified candidates? Neffke, Otto and Weyh (2017a) produced equivalent data for Germany, and their method has been vetted through formal academic peer review. There is a burgeoning research literature that uses skill relatedness and other similar measures, from where one might find further inspiration about how these data can be used to gain new insights.
To illustrate the content of the data, the table below shows the top ten industries that are most strongly related to the industry Advertising agencies. It is easy to image that these industries use similar skills compared to advertising agencies, that there is human capital overlap between them. The index spans between -1 and 1, and an index value close to 1 indicates a relatively large flow of workers between the two industries. Two additional examples can be found in the appendix: Veterinary activity and Manufacture of pharmaceuticals.
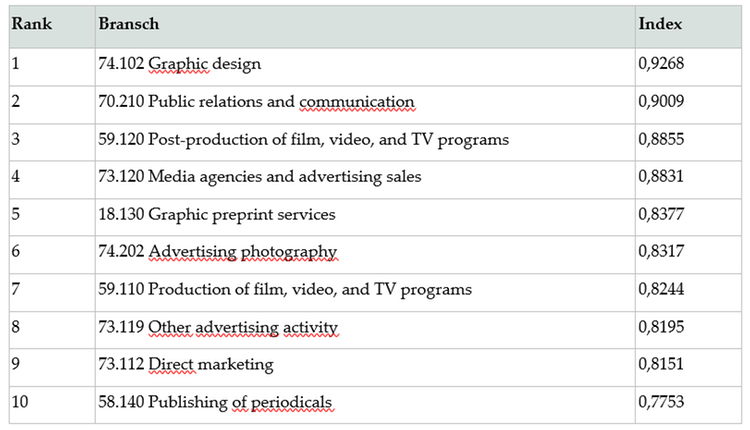
Table 1 Top ten industries related to industry 73.111, Advertising agencies
Based on this data it becomes possible to understand the economy as a network, where industries are more or less related to each other. The data can be visualized using a network graph, as in the figure below. Each node in the figure corresponds to an industry, and the links between them are the strongest relationships (high index value). For more details about the graph, see section 3.3.
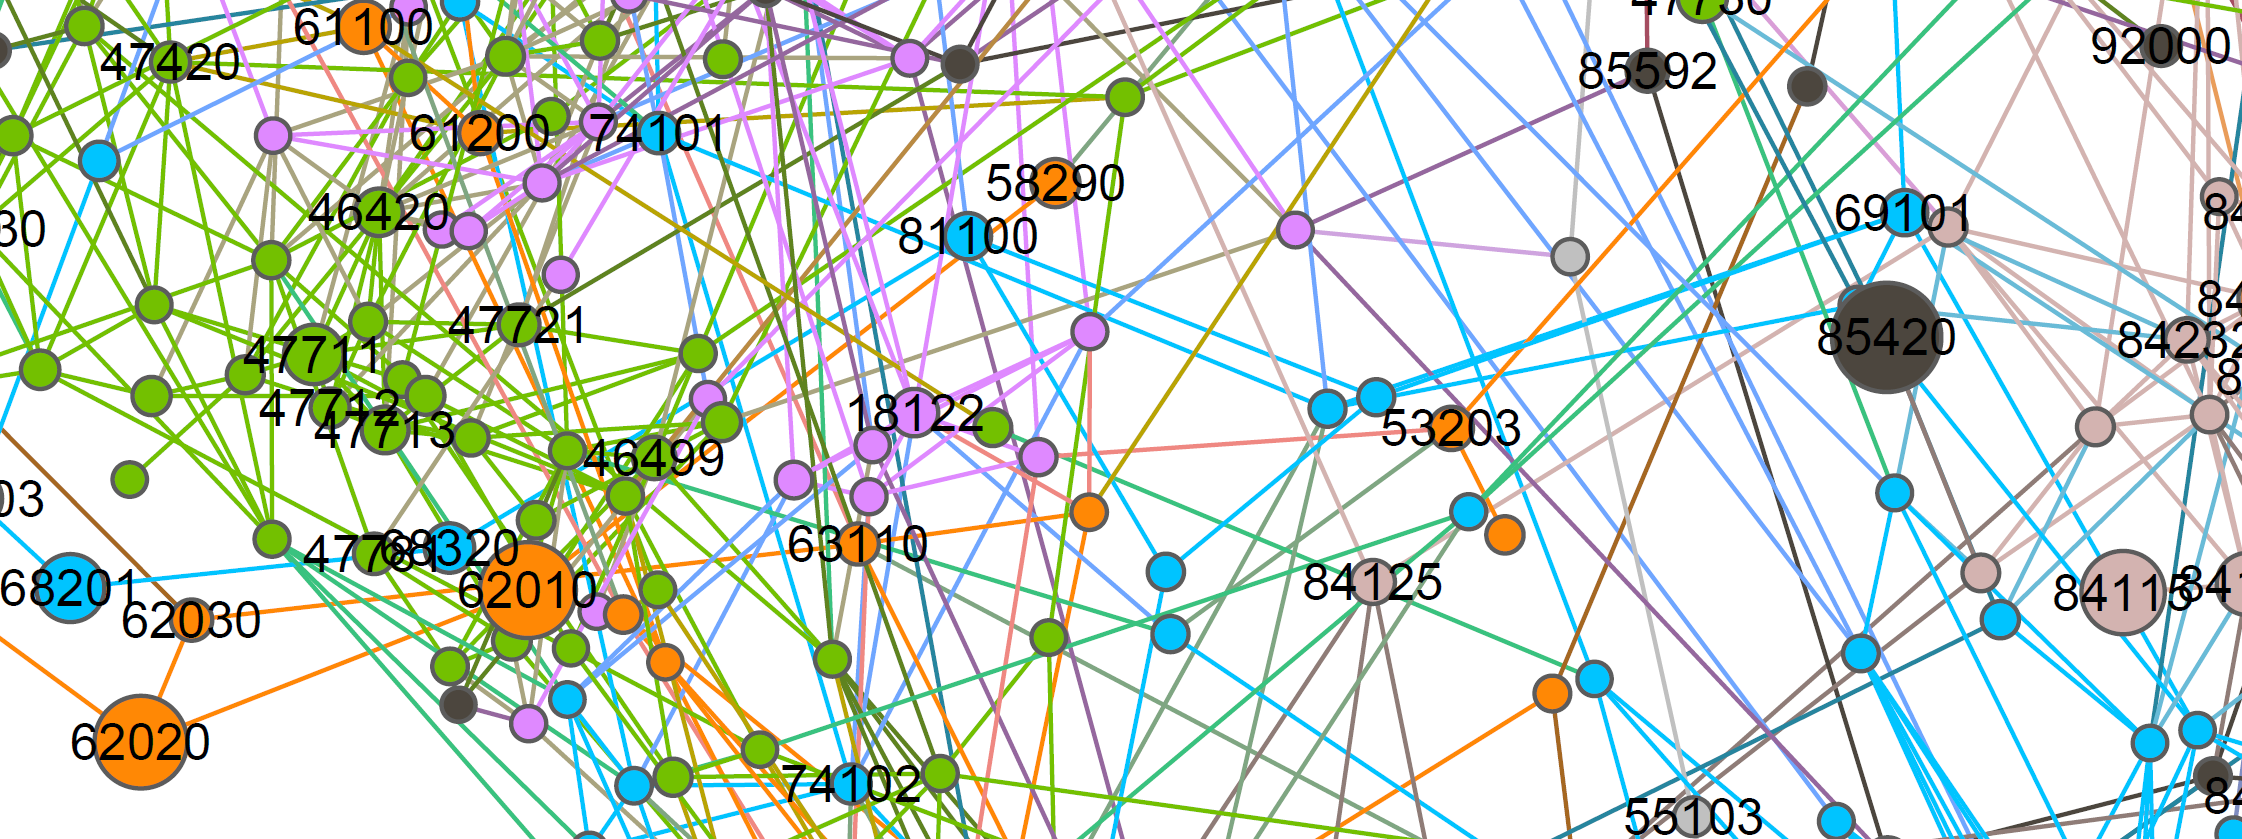
Figure 1 Network graph of the strongest relatedness links
The data consist of a collection of matrices for the current industry classification SNI 2007, as well as the older classifications SNI 2002, SNI 92 and SNI 69. For SNI 2007 there are for example five matrices, one for each level of SNI 2007. The matrices include three alternative indices based on different types of workers and are available in two formats: as text files (.csv) and as Stata datasets (.dta). Along with the data, Growth Analysis will publish the Stata code that was used to construct the index from registry data. This helps others scrutinize and build on the method.
The report includes a brief literature review, an explanation of how the index was calculated, a descriptive analysis which gives insight into the content of the resulting matrices, and a discussion of the strengths and weaknesses of the index.
Skill relatedness matrices for Sweden
Serial number: Rapport 2021:02:04
Reference number: 2020/60
Download the report in Swedish (with English summary) Pdf, 1.8 MB.
Download matrices, dta-files (zip) Zip, 15.5 MB.
Download matrices, csv-files (zip) Zip, 59 MB.
Code for Stata (zip) Zip, 12.6 kB.